

Audi Reservation Management
Enhancing the reservation management platform - a data visualization business intelligence application.
Overview
Audi wanted to enhance their reservation management platform, used by corporate to analyze reservations of new models. In this platform they are able to see all the data related to the reservations including:
Number of active, cancelled, and refunded
Reservations related to dealer, to region, and state
Customer name and date reserved
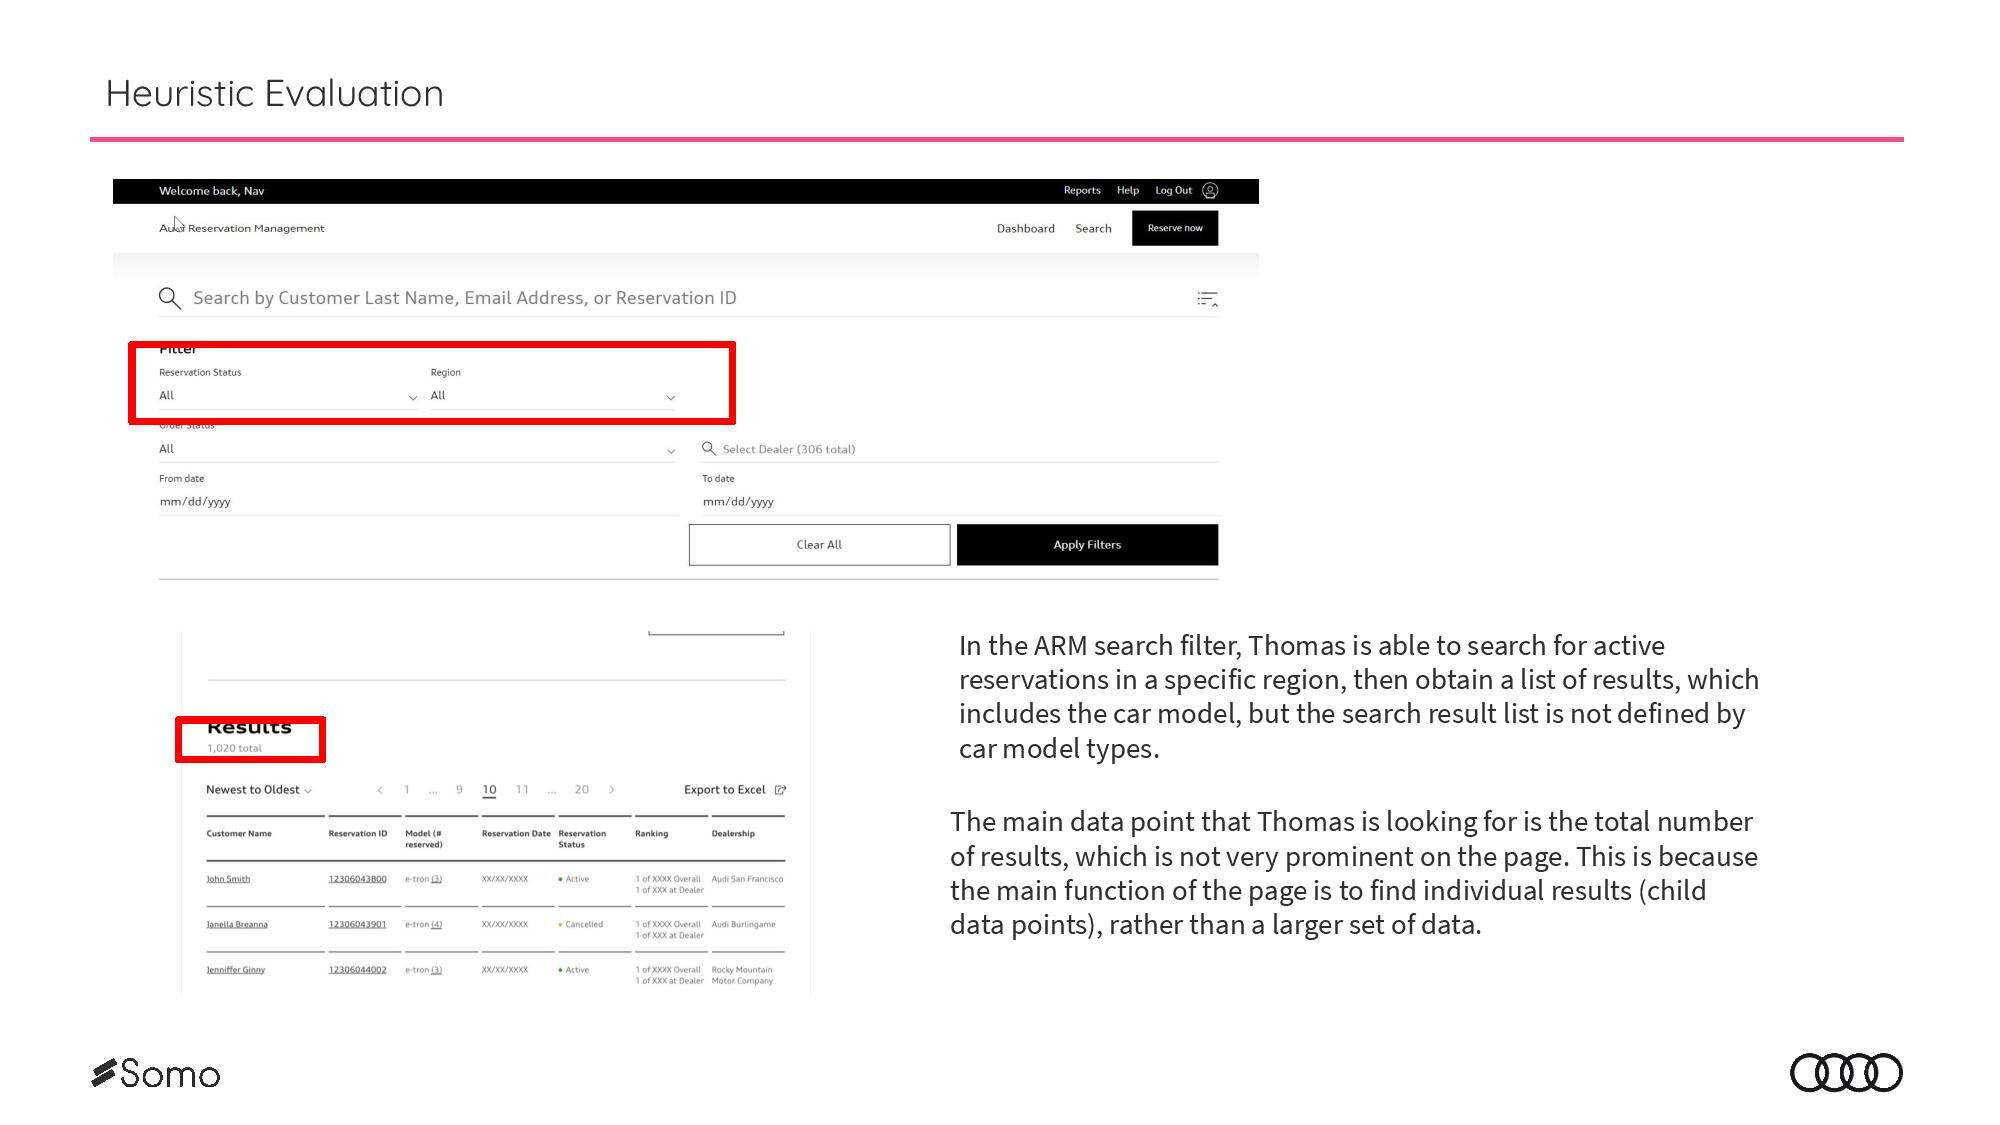
The Challenge
Enhance the Audi Reservation Management platform by adding a model/sub-brand filtering mechanism for statistic results on the dashboard.
Acceptance Criteria:
Add model + sub-brand filter to the top of the dashboard screen above all reservation totals
Filter should look like one utilized on Search
Filter drop down shall not include reservation status or order status
Show what is being filtered on as text (similar to search)
As a corporate user, I should be able to select model or sub-brand filters at the very top of the page, so it updates all stat results
Business Goals
Improve filtering and data visualization for reservations in the ARM platform for corporate/business use.
The Process
As a UX Designer, I was a part of the discovery team (Scrum Master, Product Owner, Solutions Architect), and worked with the delivery team (UI Designer, Front-end + Back-end Developers, QA) to enhance the Audi Reservation Management platform.
UX Responsibilities
UX takes Domain Specifications and conducts research on progressive solutions
UX generates a wireframe(s) for each scenario
UX reviews wireframes with “Three Amigos” to make sure all acceptance criteria is met
Additional Domain Specifications are developed as part of refinement for UX
UX is reviewed with any Subject Matter Experts (Business, Legal, or IT-Sec)
UX refines wireframes
UX generates prototypes for testing
Conduct User Testing
UX finalizes wireframes & delivers to UI Designer
Research
User Insights
With the discovery team, we spoke to users about someone of their pain points, wants, and needs with the reservation management platform to find opportunities for enhancement. These were some of the findings from our research:
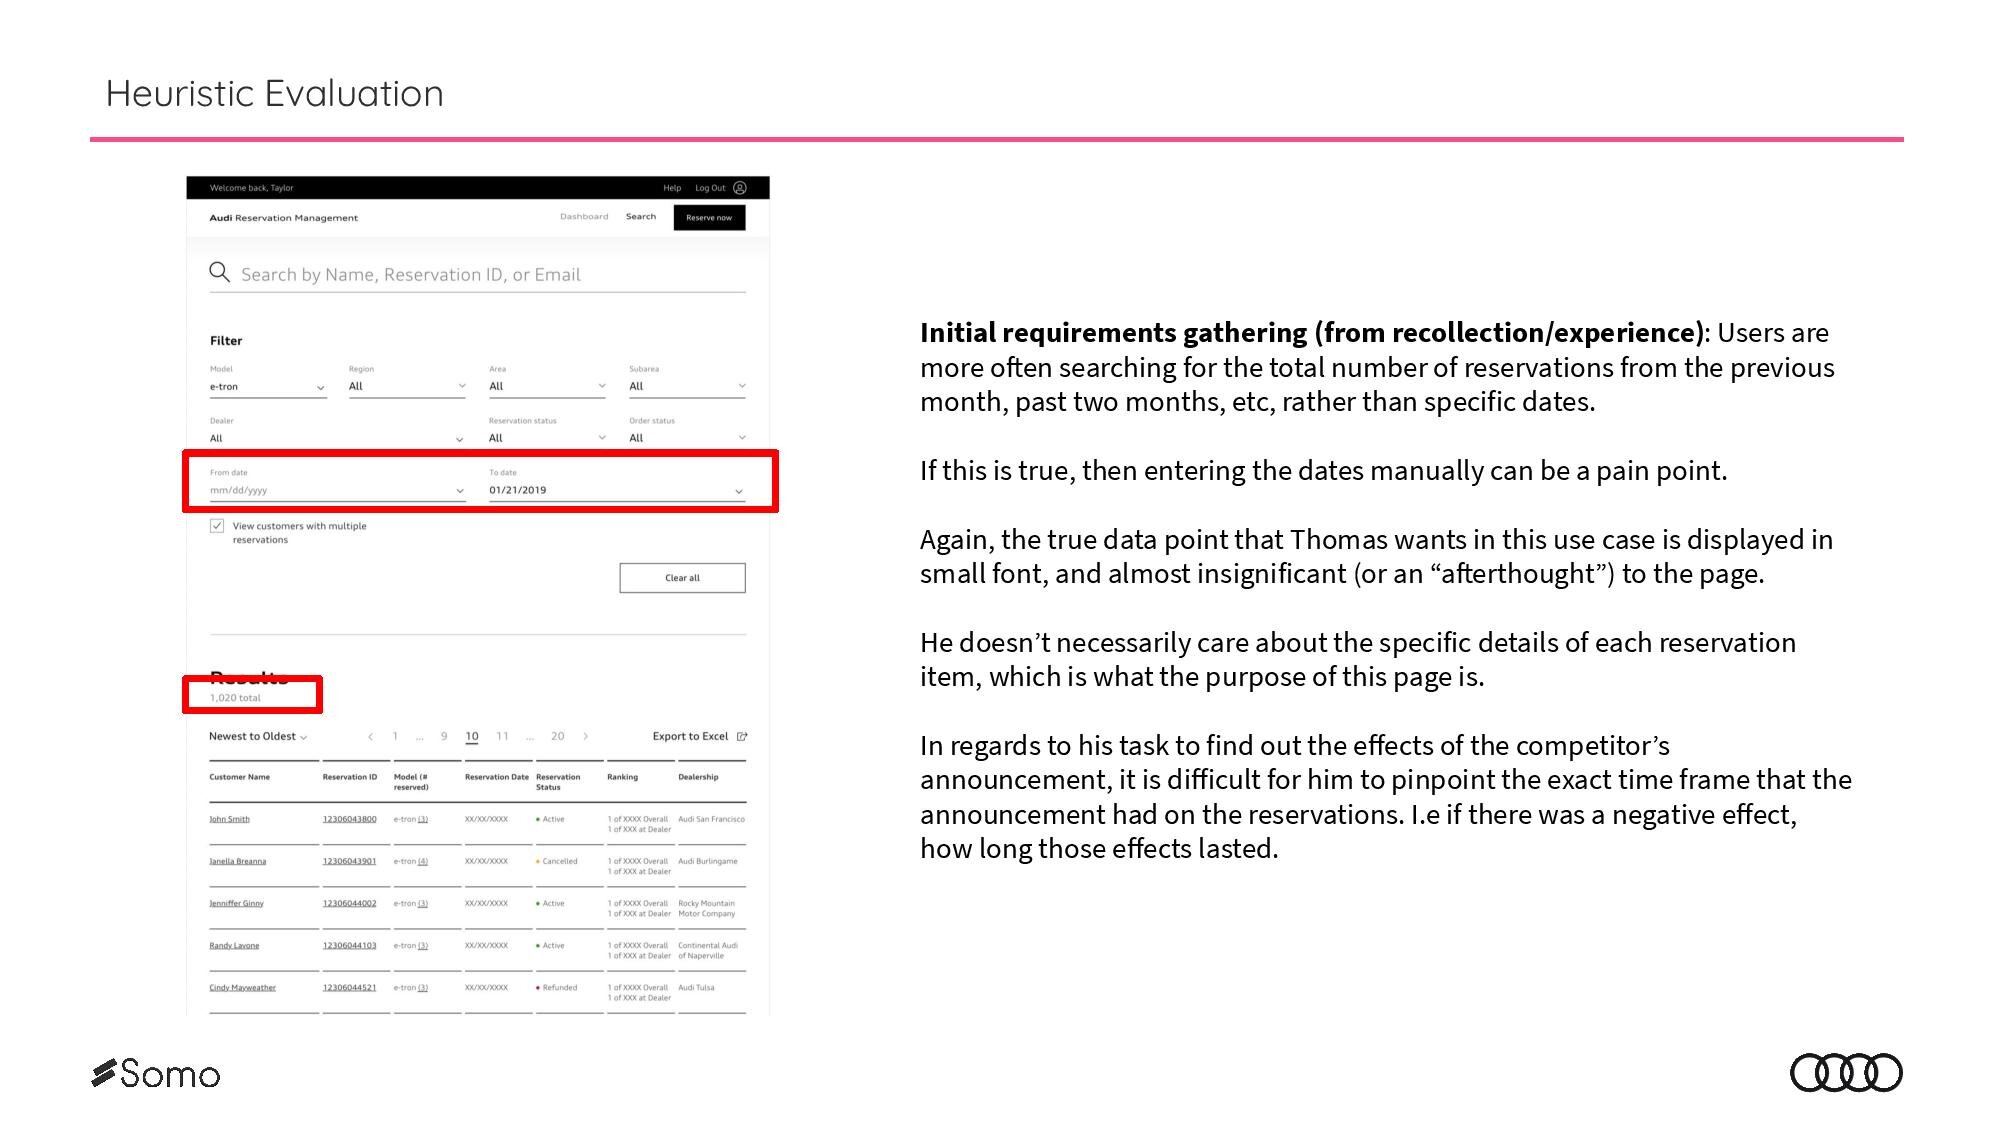
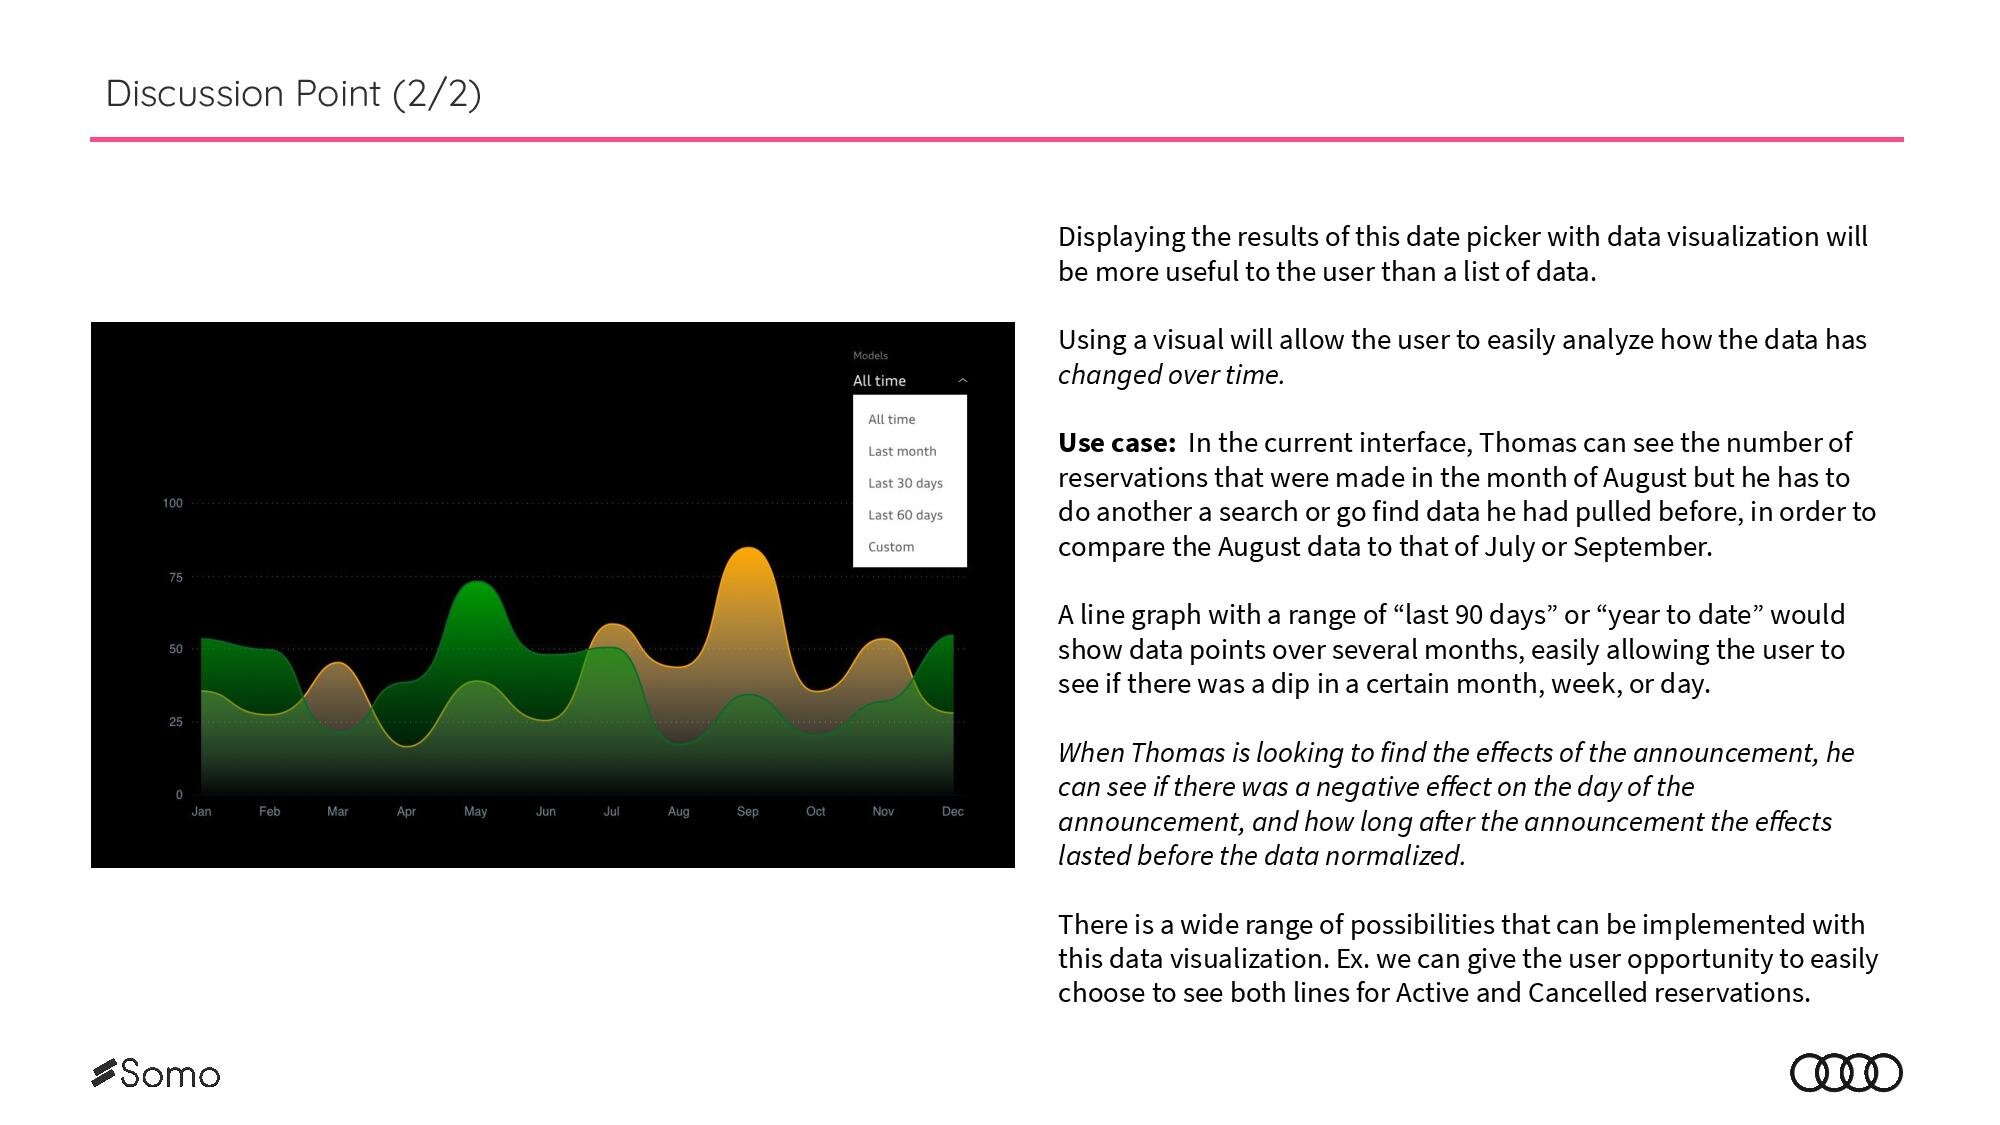
1. Add Functionality to trend aggregate numbers (Active/cancelled) Daily/Weekly/Monthly: Not sure how feasible this is in the Search area, but for tracking purposes, being able to trend activity is helpful. This will allow visibility into granular data that we could layer events that drive spikes and dips.
2. Ability to run and download aggregated trending data to excel. This would not include any PII data, just rolled up aggregates.
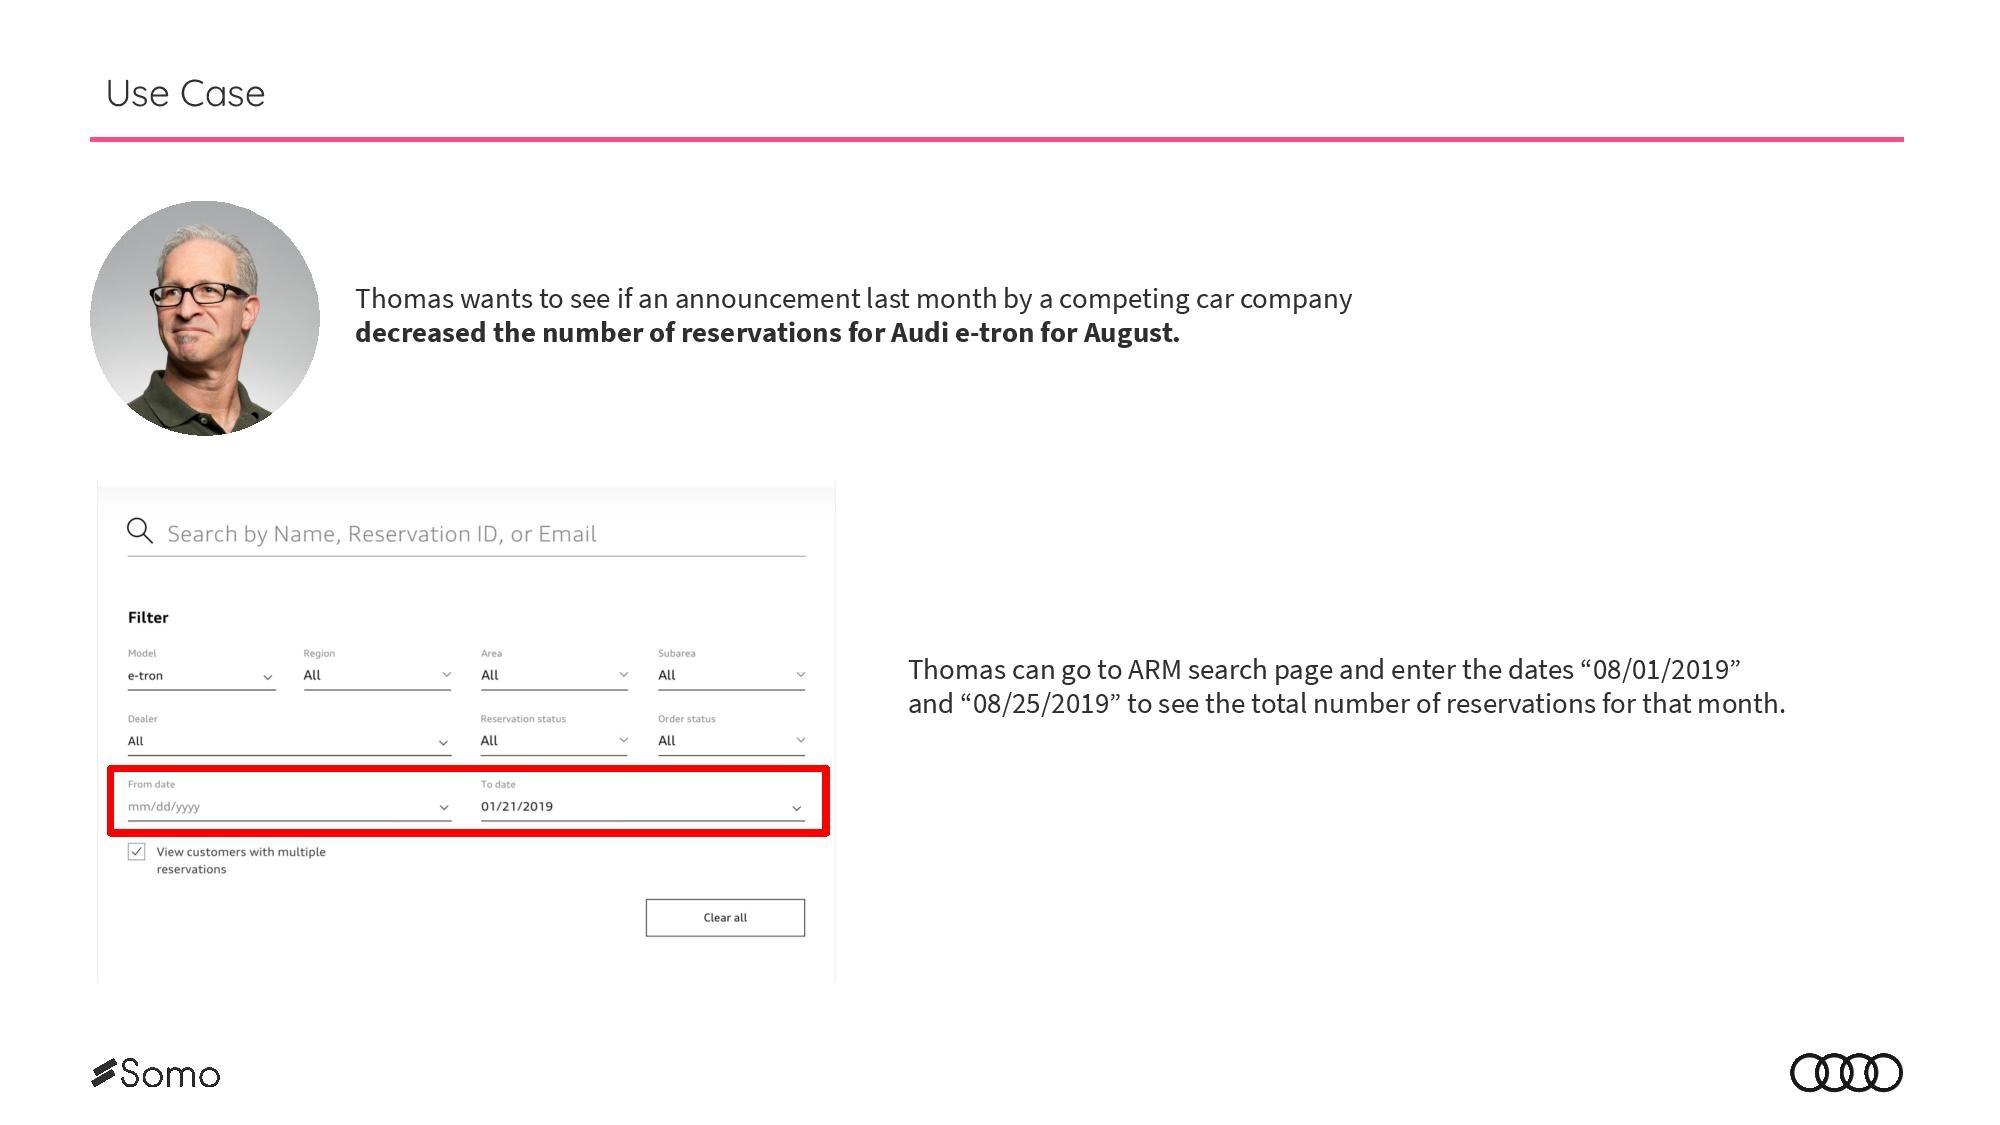
3. Preserve dates on Calendar Selector. Currently when a user returns to adjust dates, it defaults to latest date, request is to default to date specified.
a. Allow ability easily enter dates manually.

4. Ability to Multi-Select Reservation Status: This will allow us to group status (ex. Cancelled + refunded)

Identifying Opportunities
After reviewing the project requirements and the current dashboard, I presented a plan of improvements that could be made to maximize the use of data on the platform to stakeholders.
Ideation
Design Principles
Designing for Consistency for Corporate Use (Rather than Customer Facing)
This project was the only corporate use platform that I was working on. While on multiple project, it was important for the UI Designer and I to work together to differentiate the styling and design guides of a customer facing platform vs an internally used platform.
Wireframes
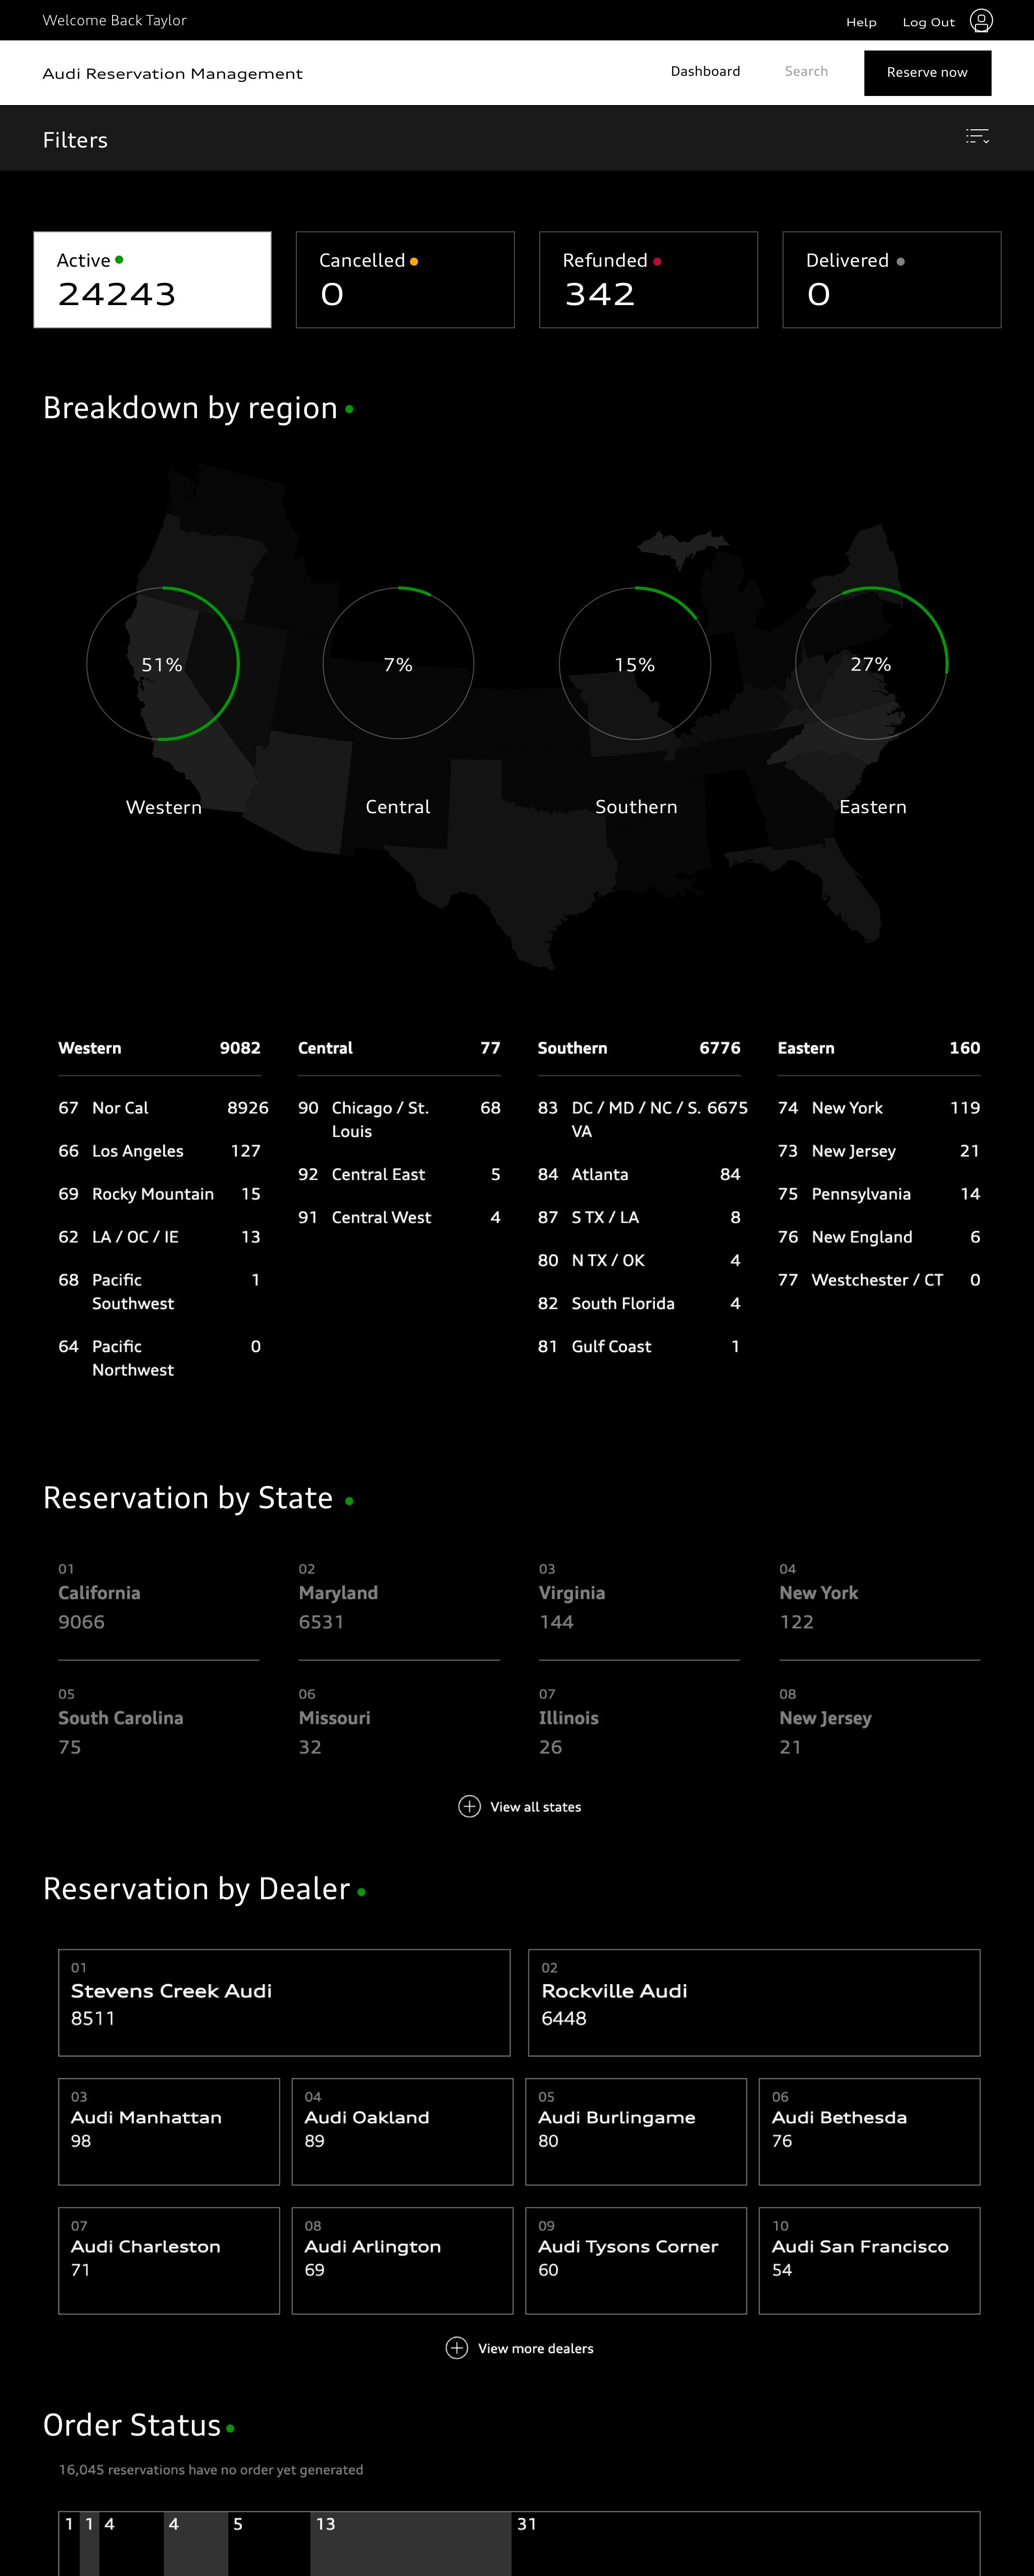
Dashboard Status Filter
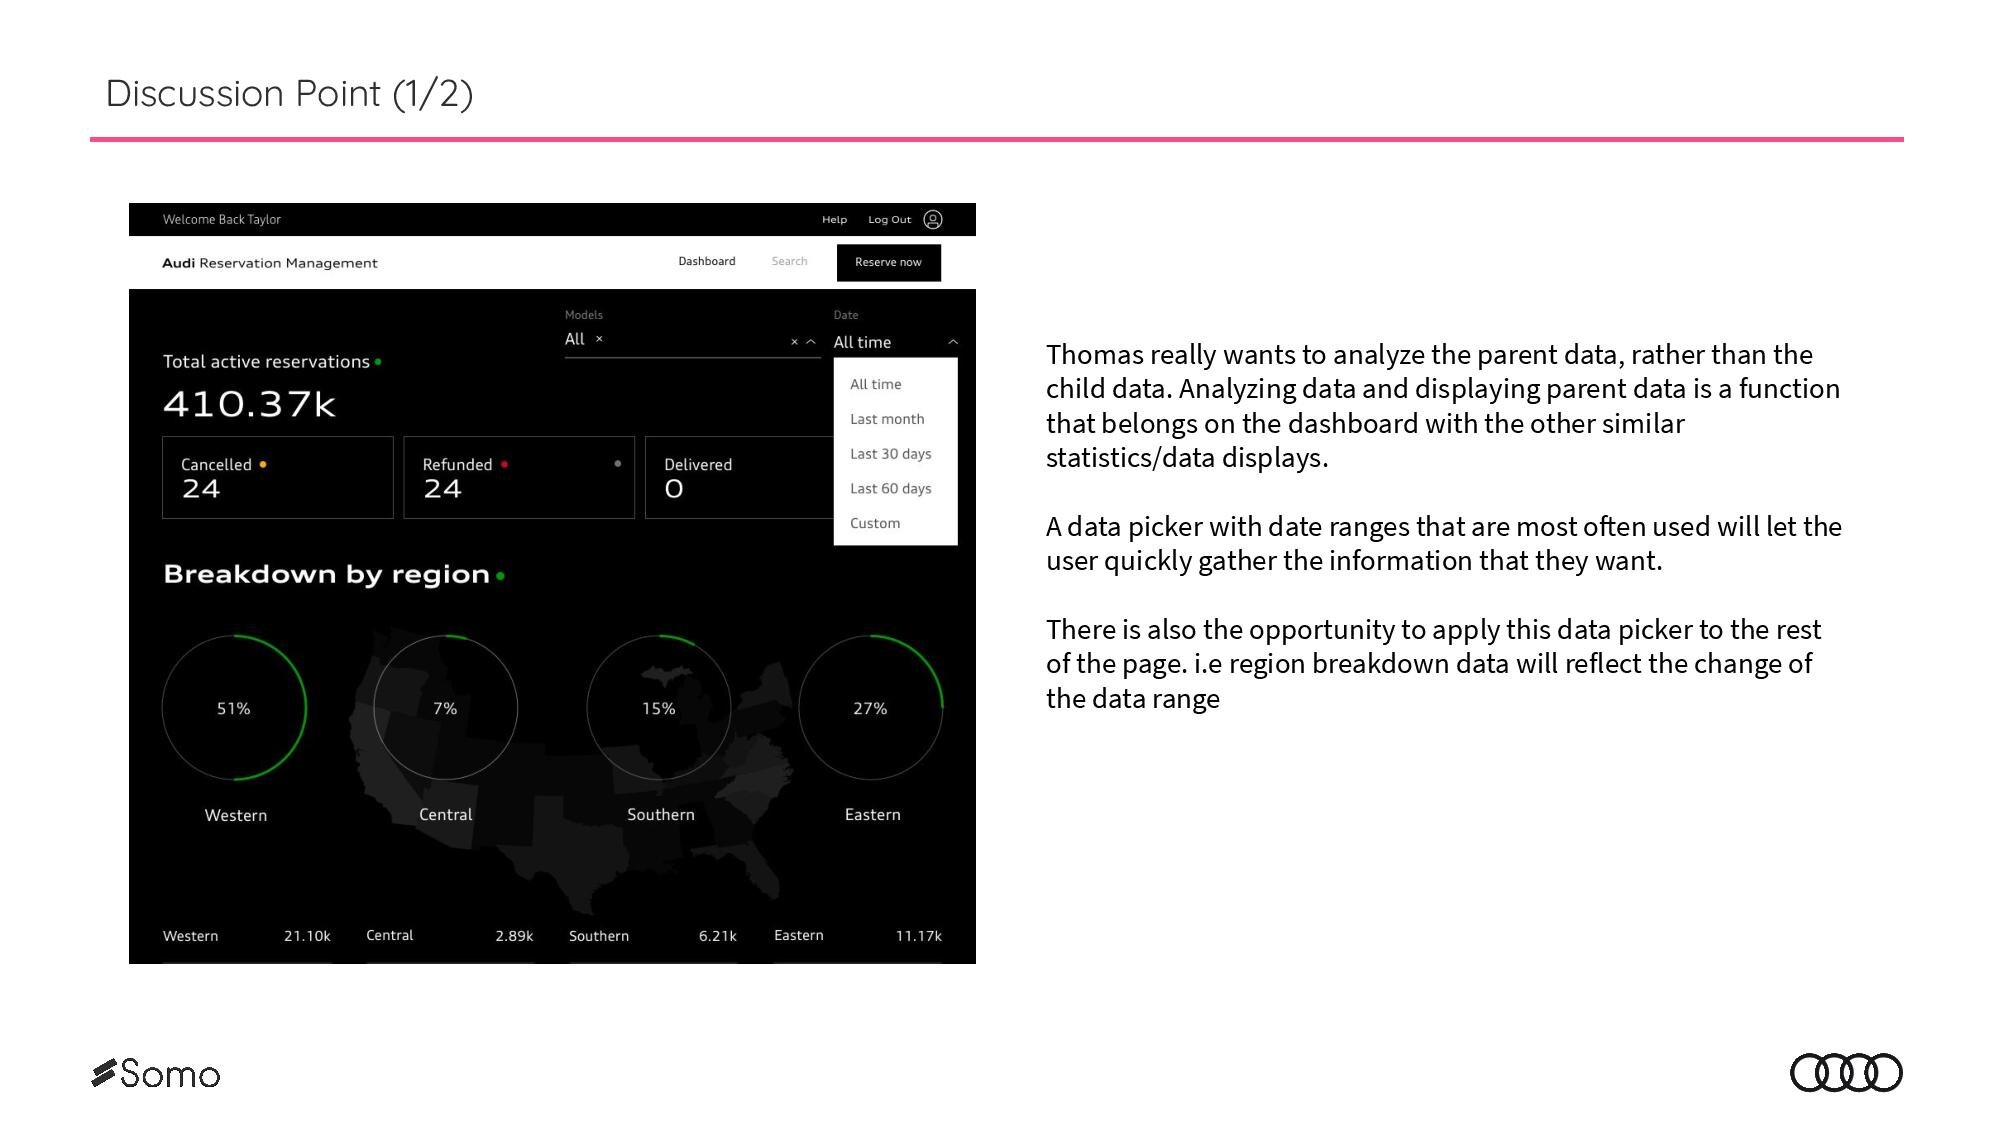
The first challenge was to redesign the main filtering functionality on the dashboard. The main dashboard has results that are filterable by Active Reservations, Cancelled Reservations, and Refunded Reservations. We wanted to provide a way for the user to be able to quickly see the reservation data by status.
The first change we made was making the status boxes interactive. The left is the original design, where to filter the reservations by status, you would have to go into the filter bar. The boxes were not interactive. On the right, we redesigned it so that all the status boxes were clickable, and would reconfigure the data on the page based on the status that was selected. (See prototype links at the end of the page)
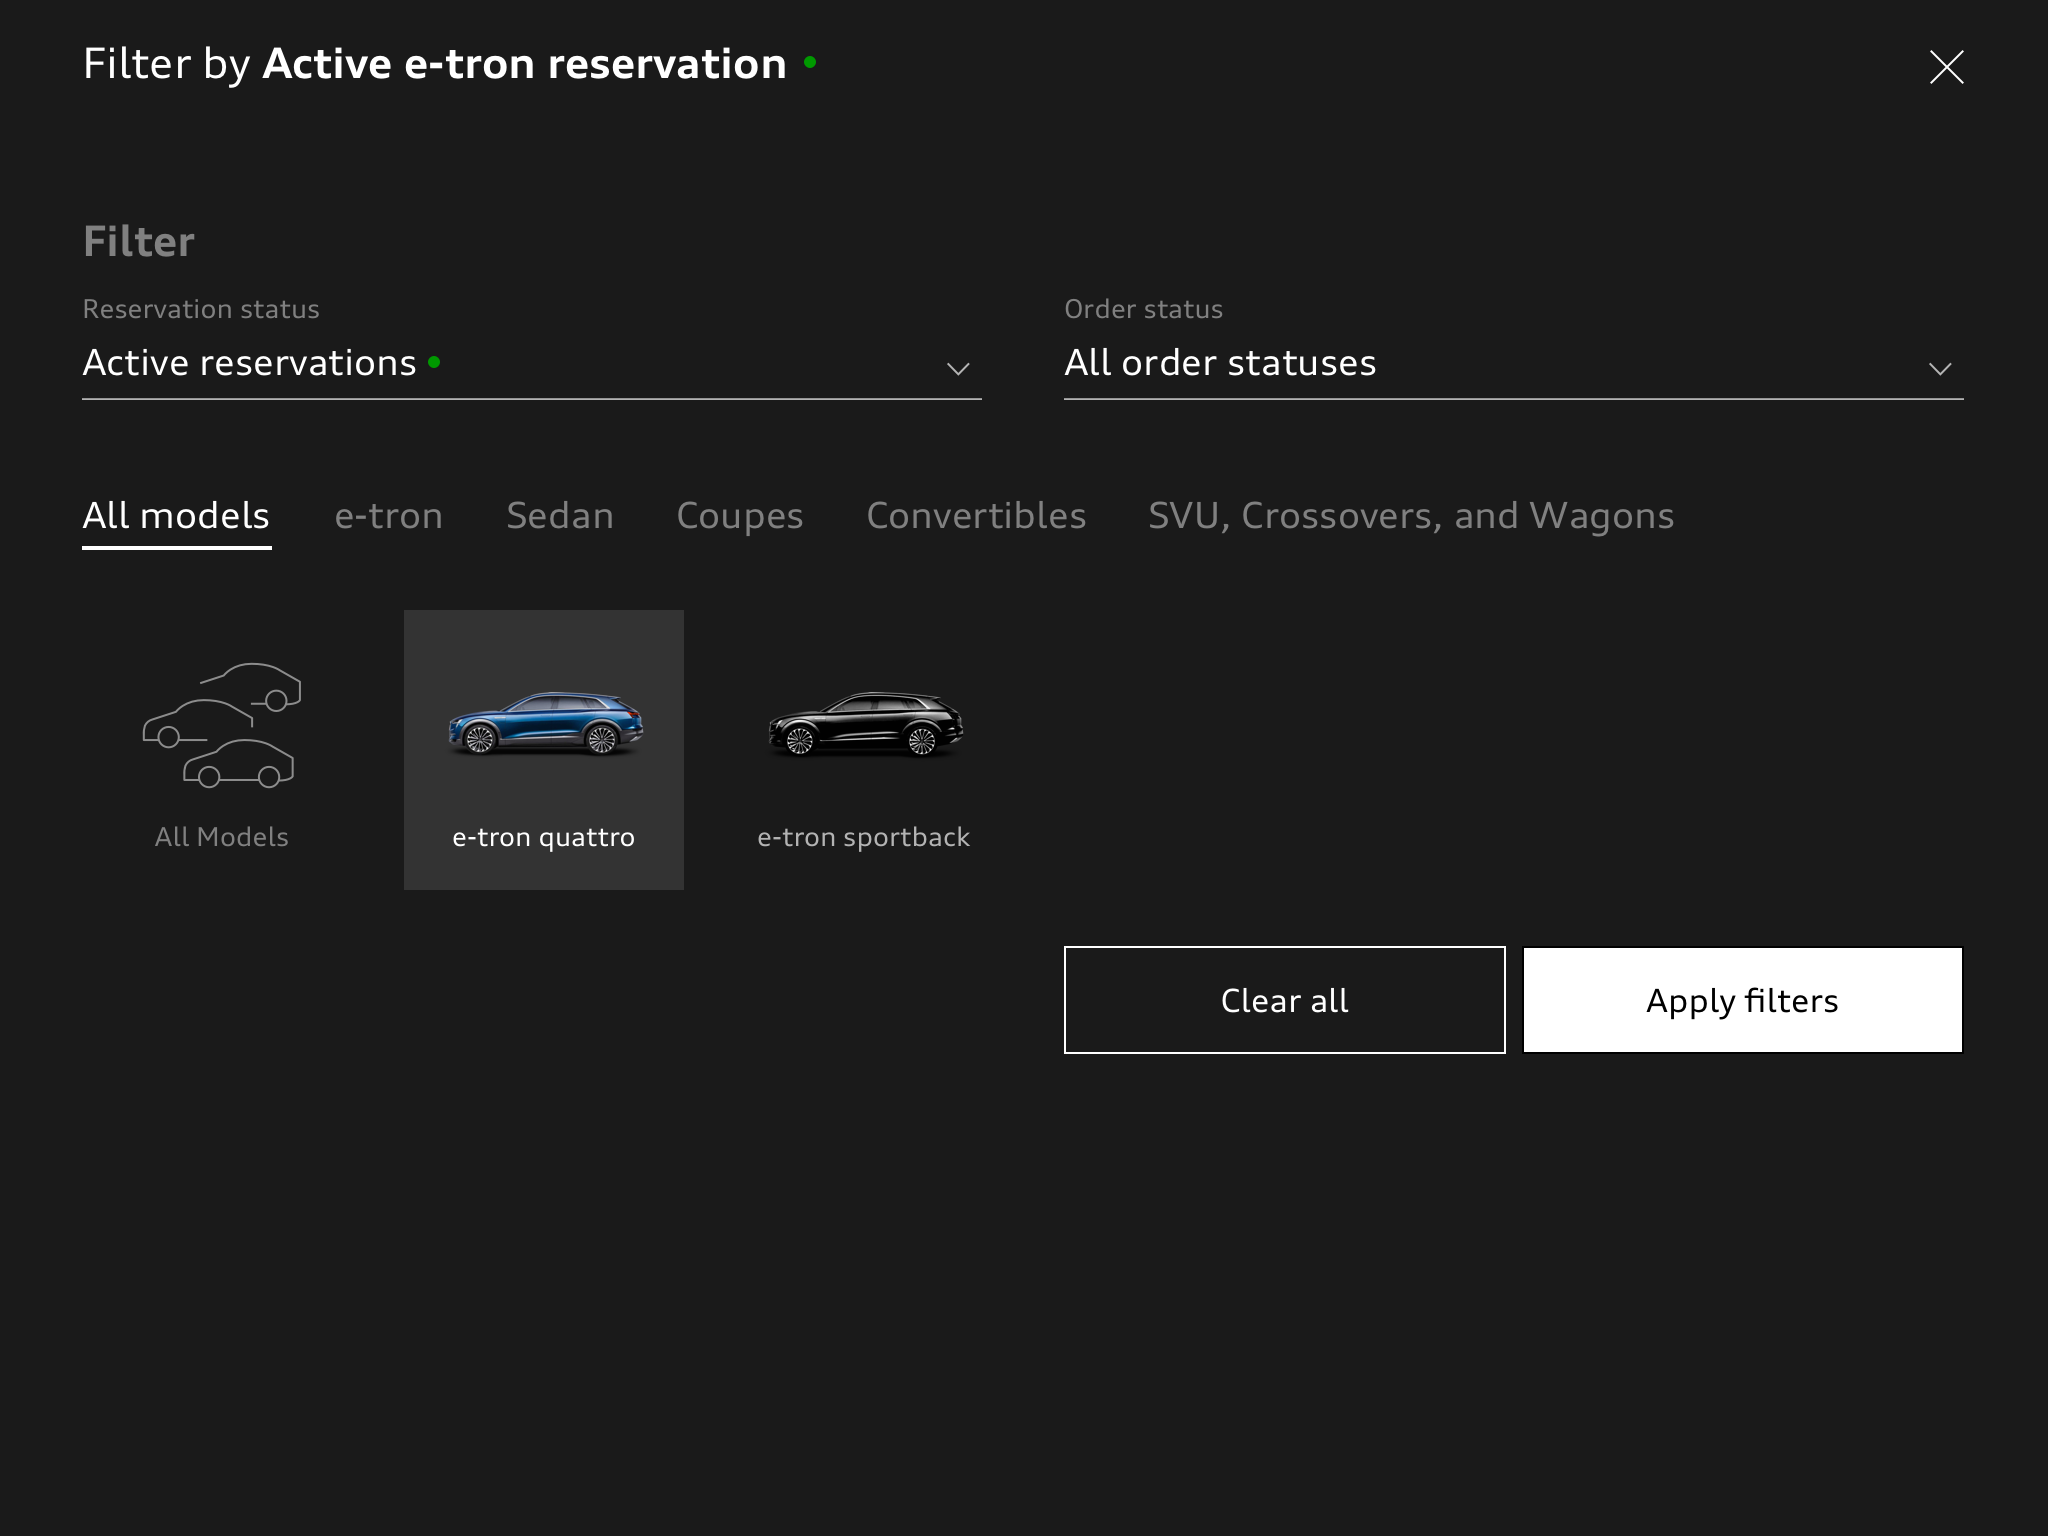
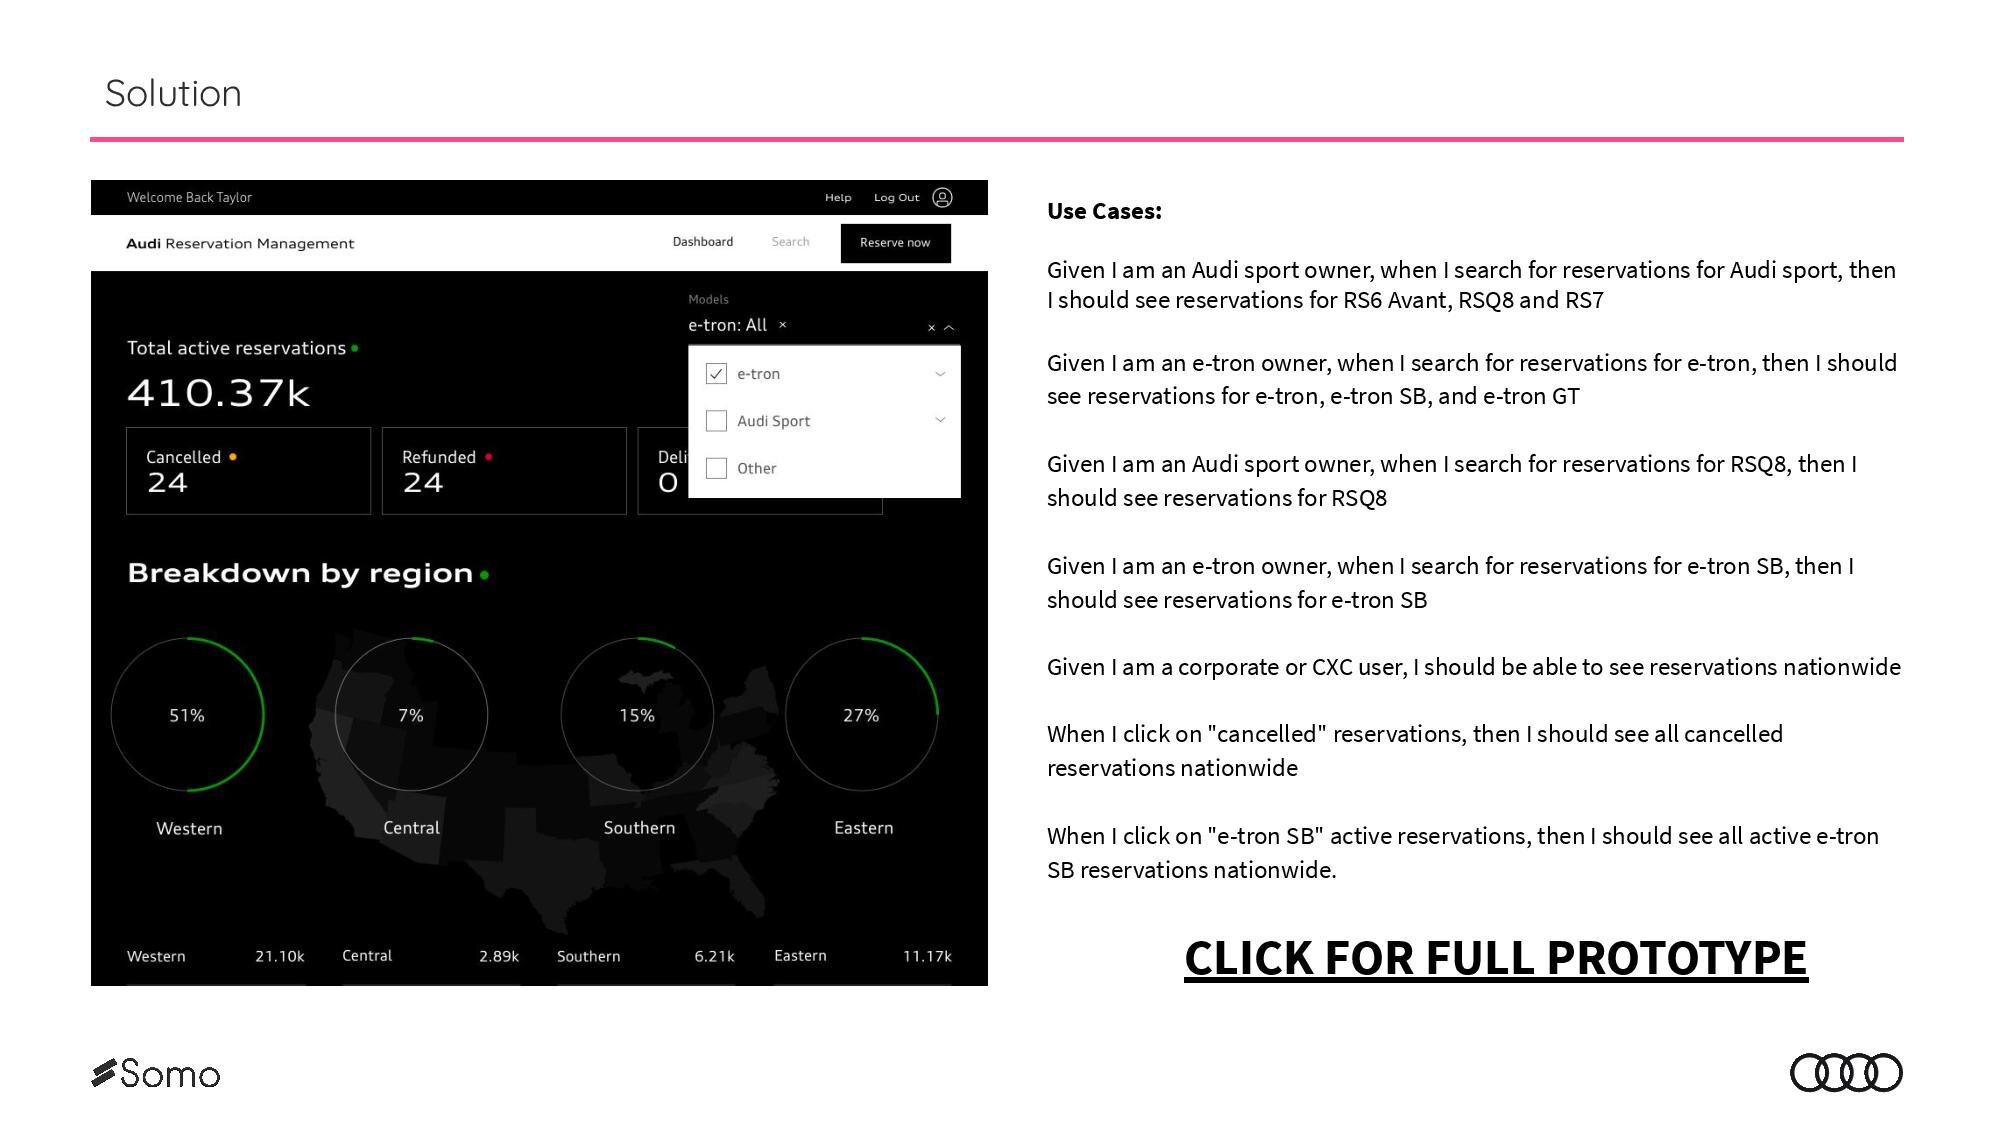
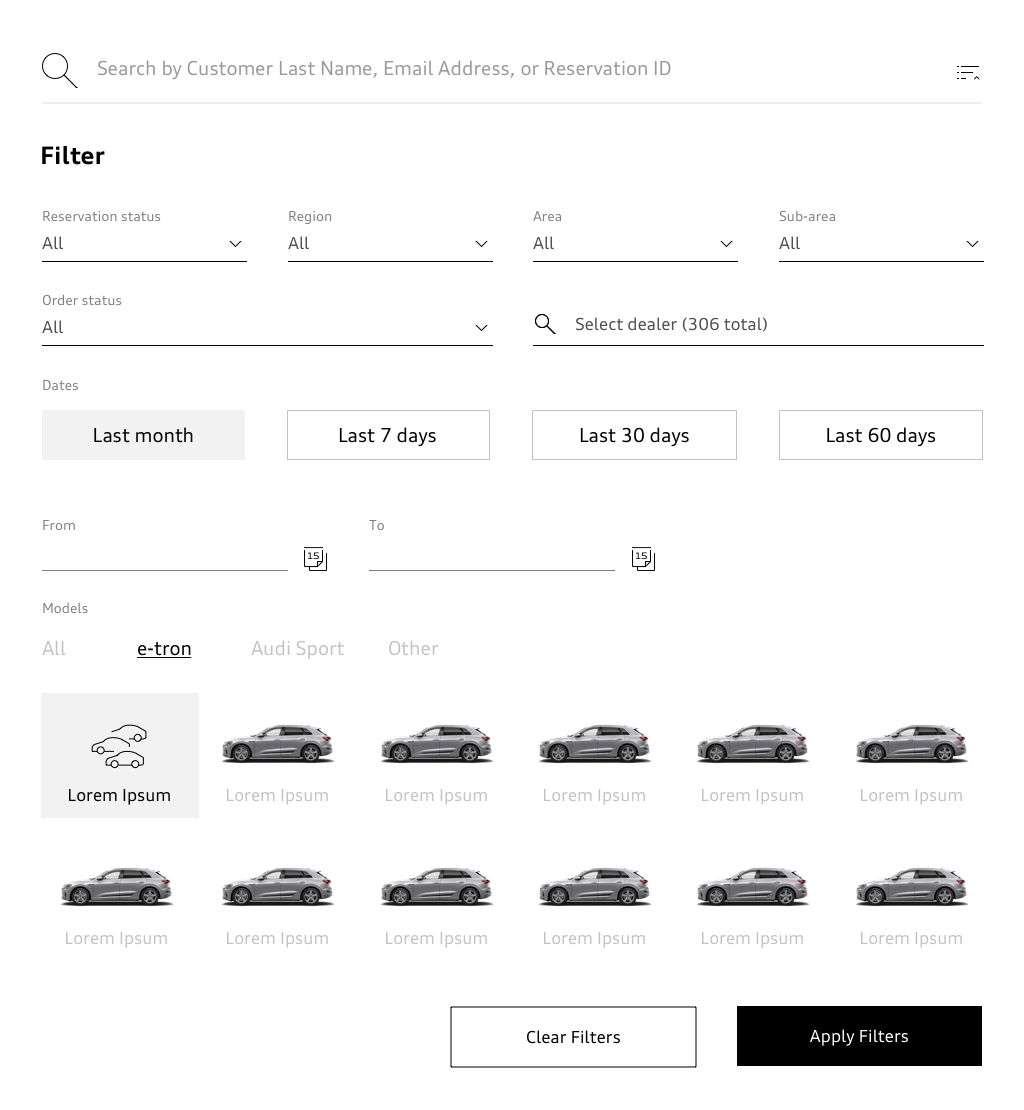
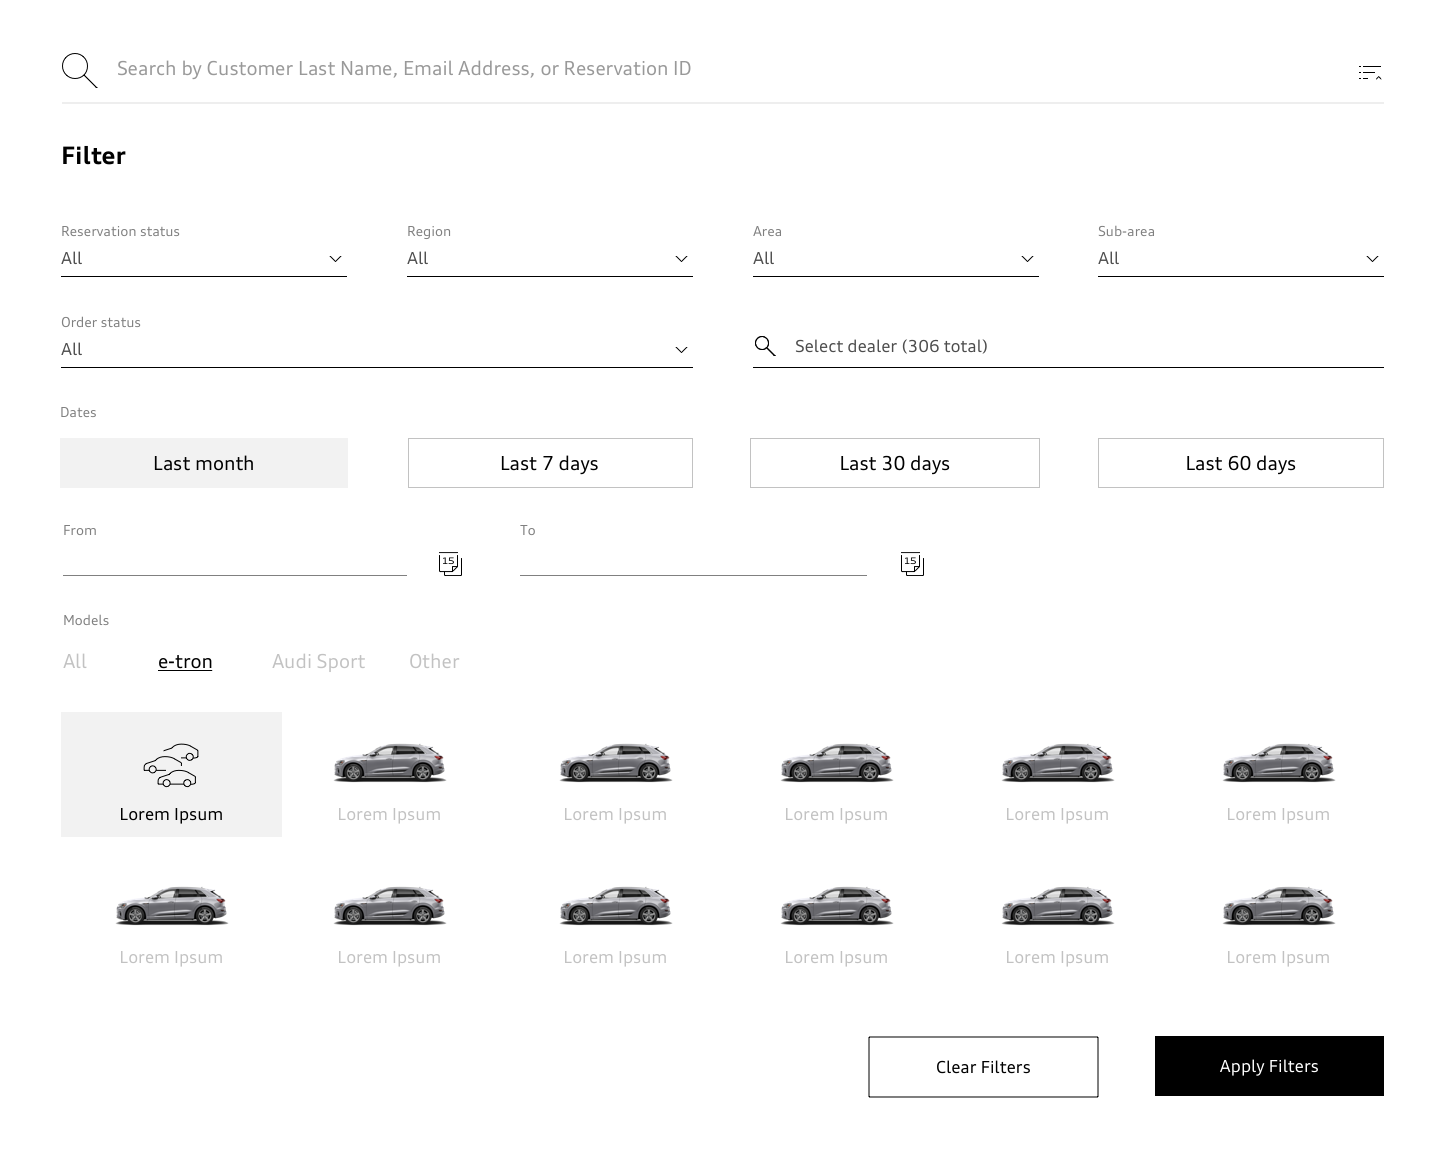
Search by Model


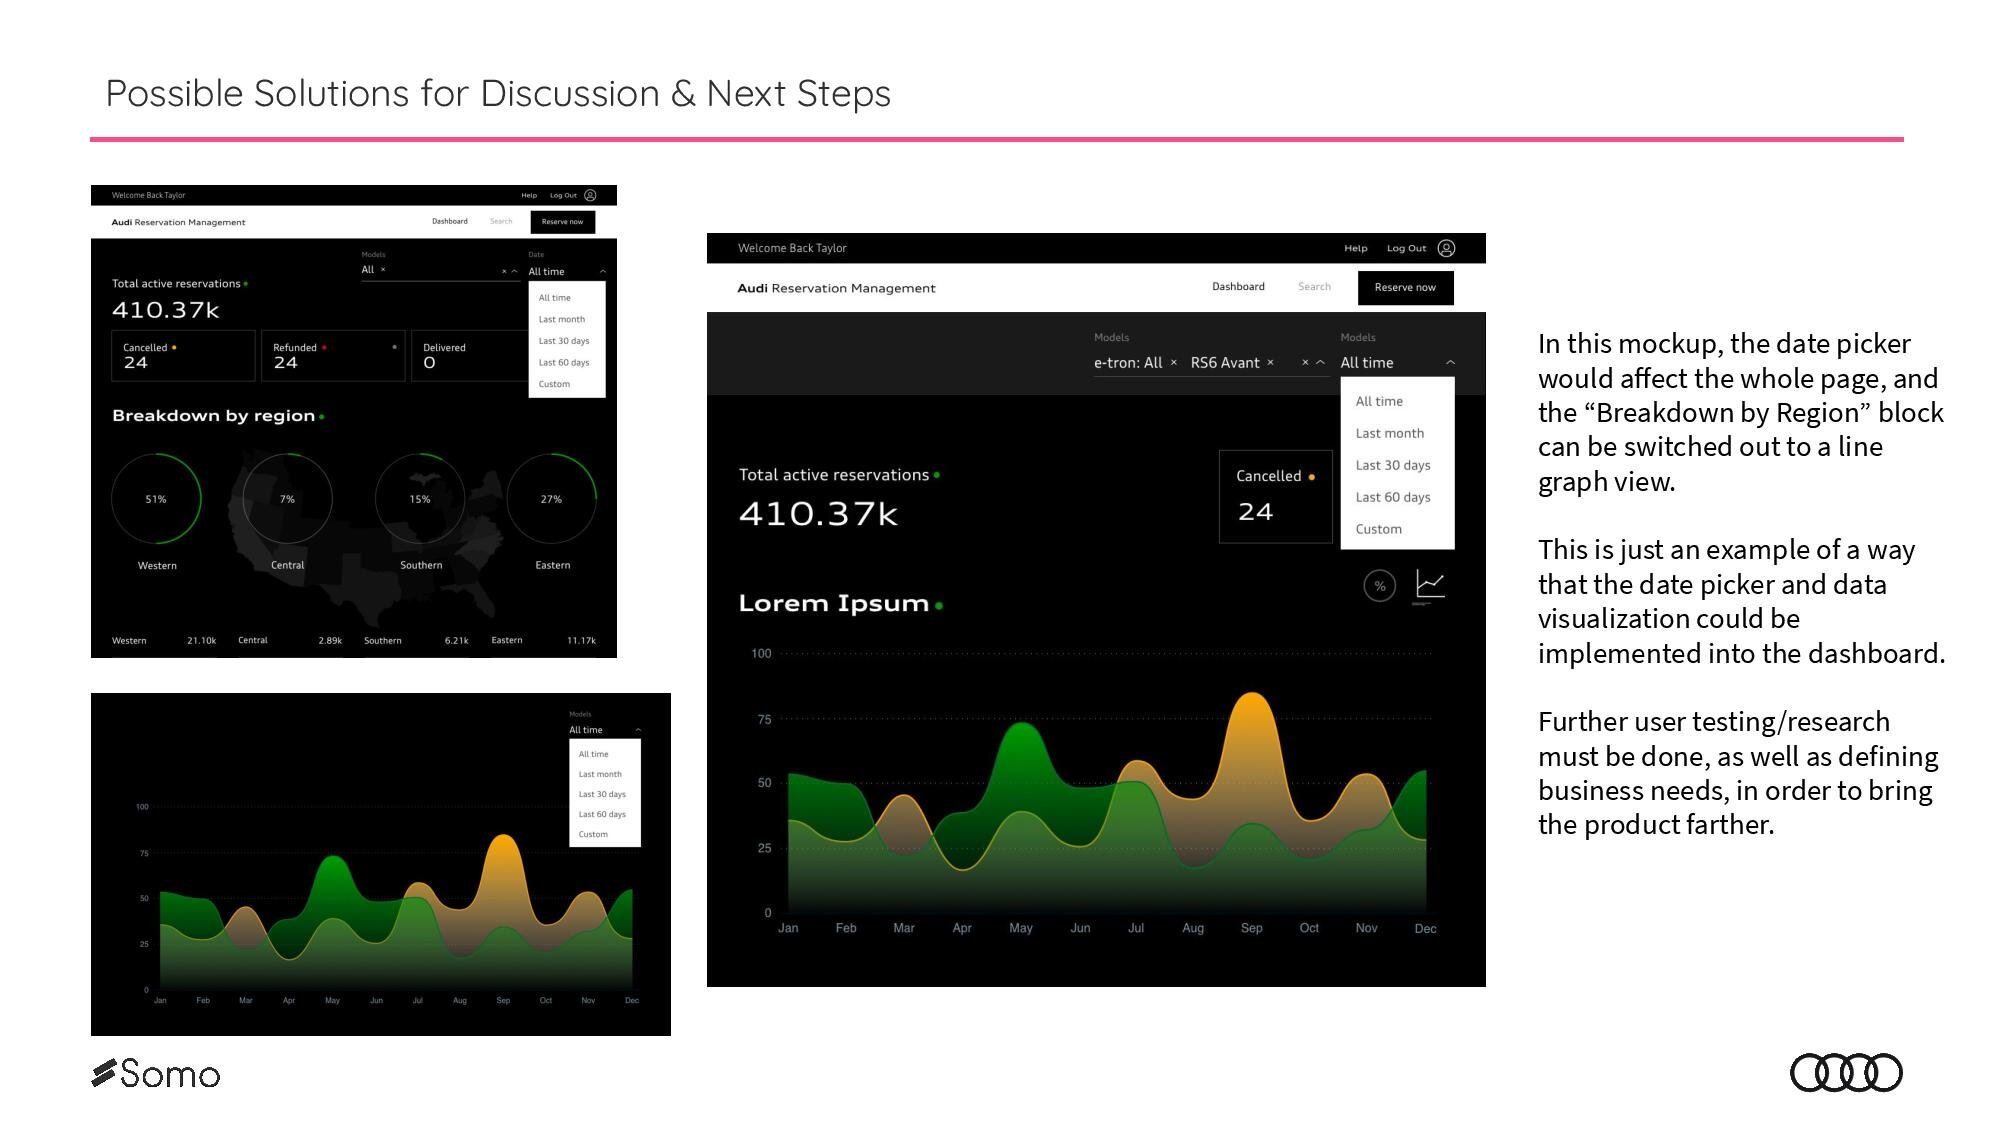
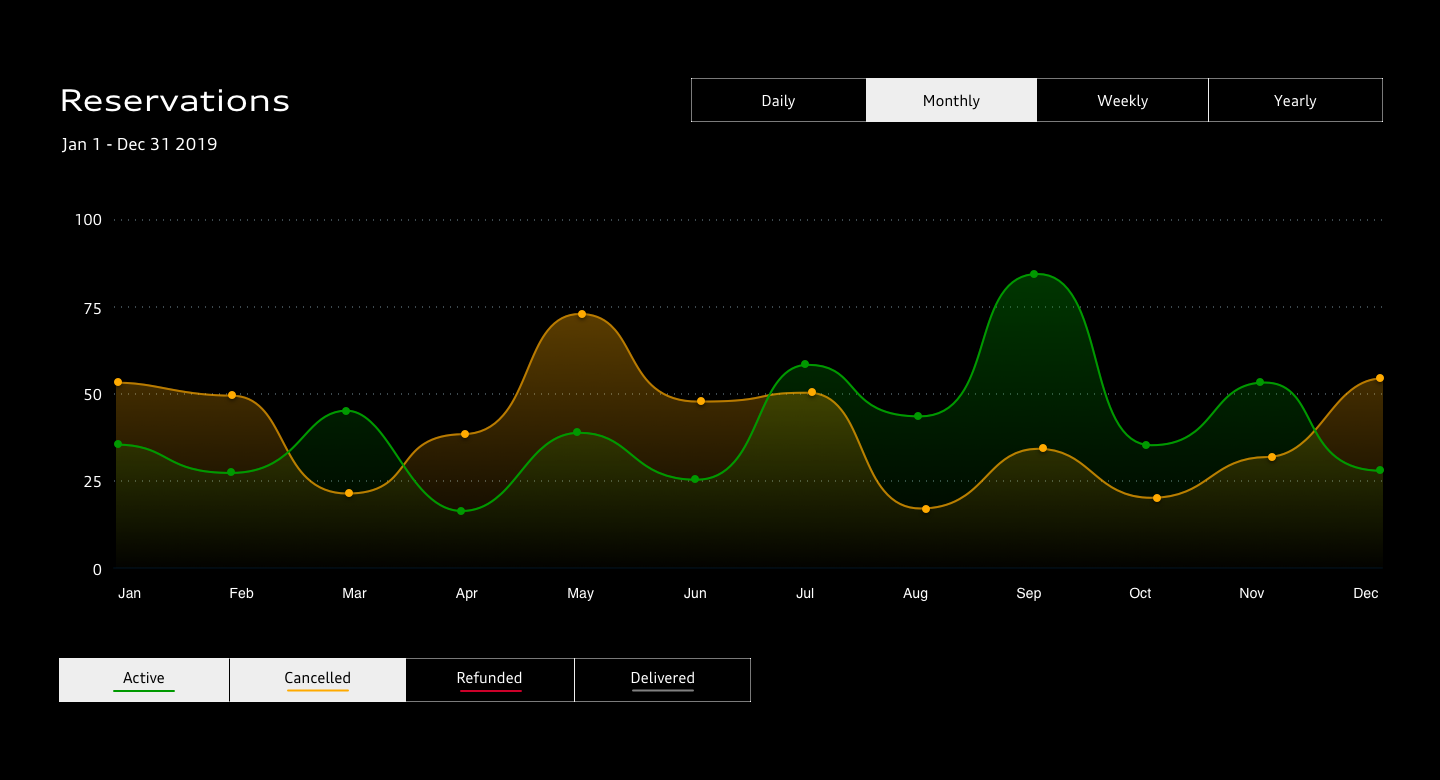
Additional Data Visualization


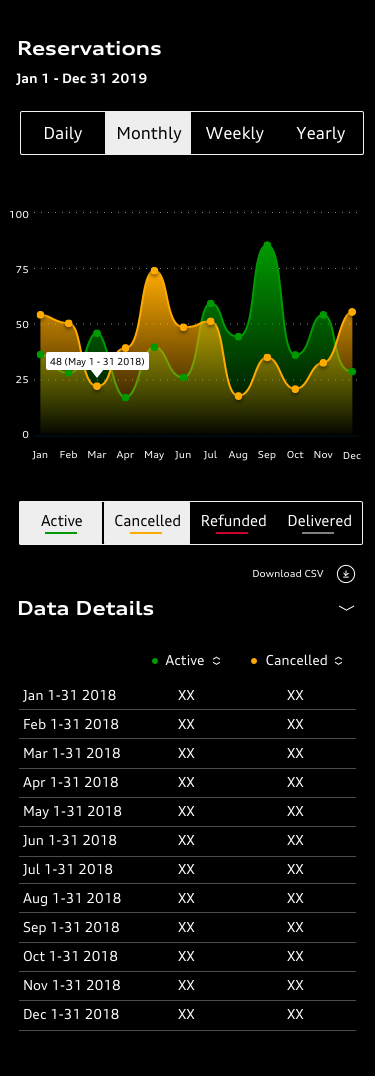

Final UI Designs
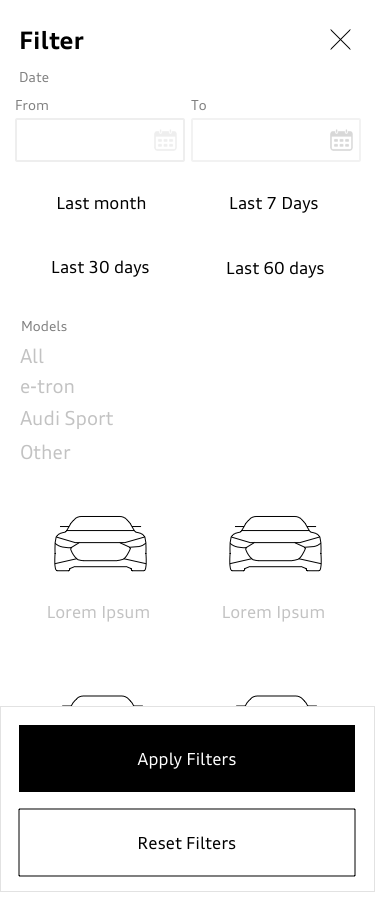
Filter


Graphs


Full Page

Results & Key Takeaways
Challenging the Challenge
During this project, the original task was to add a filtering mechanism for the dashboard page. While solving this issue, I found another opportunity to maximize the use of the data in the management platform. Therefore, I suggested the addition of an additional visual analytical tool that would increase the value of the platform.